Browser automation revisited - meet Puppeteer
I've always been more interested in back-end technologies, scalability, and security. But during the past years, I had my fair share of working on the frontend as well. These stories included testing the UI with functional tests, mostly using Selenium. When it came to that, the team usually went with Nightwatch - if you are interested in how to get started with Nightwatch, read my article on the RisingStack blog: End-to-end testing with Nighwatch.
However, to run Selenium tests, you need a Selenium server/cluster running locally or in the cloud, and also browser drivers to control Chrome, Firefox or any other browser. This simply has too many components, and hard to get right. Debugging tests written for Selenium can also be challenging - even simple things like grabbing the console output from test cases, slowing down tests so you can see what's going on or intercepting requests.
Wouldn't it be better to have a single tool to handle browser automation? 🤔
Puppeteer is a Node library which provides a high-level API to control headless Chrome over the DevTools Protocol. It can also be configured to use full (non-headless) Chrome.
Puppeteer comes as an npm package, and requires Node.js v6.4.0 at least - but as Node.js v8 became LTS a few weeks back, I recommend running it on Node.js 8. Once you add Puppeteer to your project using npm install puppeteer, it also downloads a recent version of Chromium that is guaranteed to work with the API.
Important note: Puppeteer is not a drop-in replacement for Selenium, it can be only used if you are okay with only automating Chrome, and you don't have a requirement on testing on Firefox, Safari or others.
After you've added Chromium to your project, you can start automating the browser by writing Node.js code:
const puppeteer = require("puppeteer")(async () => {const browser = await puppeteer.launch();const page = await browser.newPage();await page.goto("https://google.com");await page.screenshot({ path: "google.png" });await browser.close();})();
The code snippet above will open up a headless Chromium instance, create a new page, navigate it to google.com, and will do a screenshot saved to google.png. Easy, right? 👌
Let's take a look at some of the more interesting use-cases! 🎬
Helpers for debugging
For me, one of the biggest pain points of using Selenium was the visibility into how tests are working, and the (lack) of options to debug them. Puppeteer comes to the rescue when it comes to debugging.
Accessing console output
You can add a console listener on the page object to grab log lines written in the browser instance.
page.on("console", (msg) => {console.log("console:log", ...msg.args);});
Launching a full version of Chrome & slow motion
Sometimes it can be very useful to see what is displayed in the browser and what actions are executed. In these cases you can disable the headless default of Puppeteer, and launch it this way:
const puppeteer = require("puppeteer")(async () => {const browser = await puppeteer.launch({headless: false,slowMo: 250, //ms});const page = await browser.newPage();await page.goto("https://google.com");await page.screenshot({ path: "google.png" });await browser.close();})();
Grabbing full page screenshots
In Puppeteer you can easily define the size of the viewport, using the page.setViewport method. However, sometimes you want to grab the full page as an image or pdf, not just the viewport. With Puppeteer you can do that easily:
const puppeteer = require("puppeteer")(async () => {const browser = await puppeteer.launch();const page = await browser.newPage();await page.goto("https://google.com");await page.screenshot({path: "google.png",fullPage: true,});await browser.close();})();
Alternatively, you can also define clipping regions using the clip option.
Recording page profiles
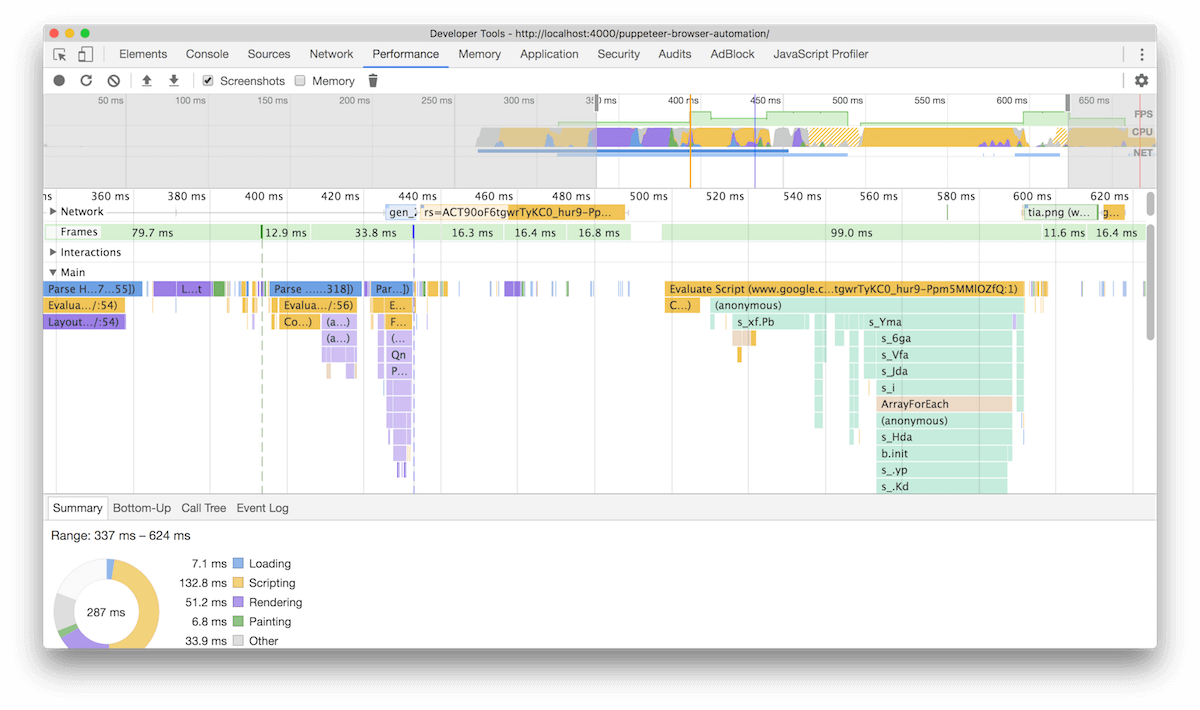
You can also easily grab traces for different actions or page loads using Puppeteer:
const puppeteer = require("puppeteer")(async () => {const browser = await puppeteer.launch();const page = await browser.newPage();await page.tracing.start({path: "trace.json",});await page.goto("https://google.com");await page.tracing.stop();await browser.close();})();
Once you have the trace file, you can open up the Chrome Devtools, and load it into the Traces tab:

You can simply add it to your continuous integration pipeline, grab a trace for all your deployed revisions, and compare them on a regular base to detect performance degradations. Using the timeline-viewer, you can easily compare different traces. Oh, and by the way it is open-source too: https://github.com/ChromeDevTools/timeline-viewer 👏
Intercepting HTTP requests
Using Puppeteer you can intercept, modify, abort or continue requests. It comes handy when you test cases when the browser loses connection to the servers, or any other problem occurs.
const puppeteer = require("puppeteer")(async () => {const browser = await puppeteer.launch();const page = await browser.newPage();await page.setRequestInterception(true);page.on("request", (request) => {if (request.url.includes(".png")) {request.abort(404);} else {request.continue();}});await page.goto("https://www.google.com");await page.screenshot({ path: "google.png" });await browser.close();})();
If you run the example above, you will see that the Google logo got disabled 😯:

Puppeteer on Travis CI
Running Puppeteer is a piece of cake when it comes to CI environments - as a matter of fact, this blog is already using Puppeteer for a small functional test!
The test checks if all the posts that going to be published have a comments section. It does that by visiting all the posts, clicking the add comment button, and see if the GitHub issue's title is the same as the post's title.
it("has github issues to let users comment for all the posts", async () => {await page.goto("http://localhost:4000");const posts = await page.$$eval(".post-list a", (posts) => {return posts.map((post) => post.href);});for (let i = 0; i < posts.length; i++) {let post = posts[i];await page.goto(post);const pageTitle = await page.$$eval(".posttitle", (title) =>title[0].innerHTML.trim());const githubUrl = await page.$$eval(".blog-post-comment-button",(a) => a[0].href);await page.goto(githubUrl);const githubTitle = await page.$$eval(".js-issue-title", (span) =>span[0].innerHTML.trim());assert.deepEqual(pageTitle, githubTitle);}});
It grabs all the posts by executing the document.querySelectorAll method using page.$$eval, than visits them one-by-one.